
Data snapshot and practical anchor
Start with measurable goals: target particle size (D50), coefficient of variation (CV) for blend uniformity, and throughput required per batch. For many lab-scale problems I analyze, a pilot run of 3–5 batches yields a stable CV within ±8% and D50 convergence within 10% across runs; those are reasonable acceptance thresholds to set before equipment selection. My assessment here synthesizes published bench-scale mixing metrics and demonstrations at the Fraunhofer institutes (Germany), paired with controlled trial data using a lab powder mixer so the recommendations map to reproducible outcomes.
Core metrics that decide buyer outcomes
Quantify performance along three axes: particle-size control (D10–D90), blend homogeneity (CV or Relative Standard Deviation), and process throughput (kg/h or g/min for lab units). Power density (W/mL) and specific energy input (kJ/kg) correlate strongly with particle attrition and temperature rise; when specific energy doubles, expect more rapid size reduction but also a 2–5 °C higher temperature in typical aqueous dispersions. Track sampling frequency and n≥3 replicates to capture process variability — single-run data misleads 60–80% of the time in my experience.
Equipment classes and measured trade-offs
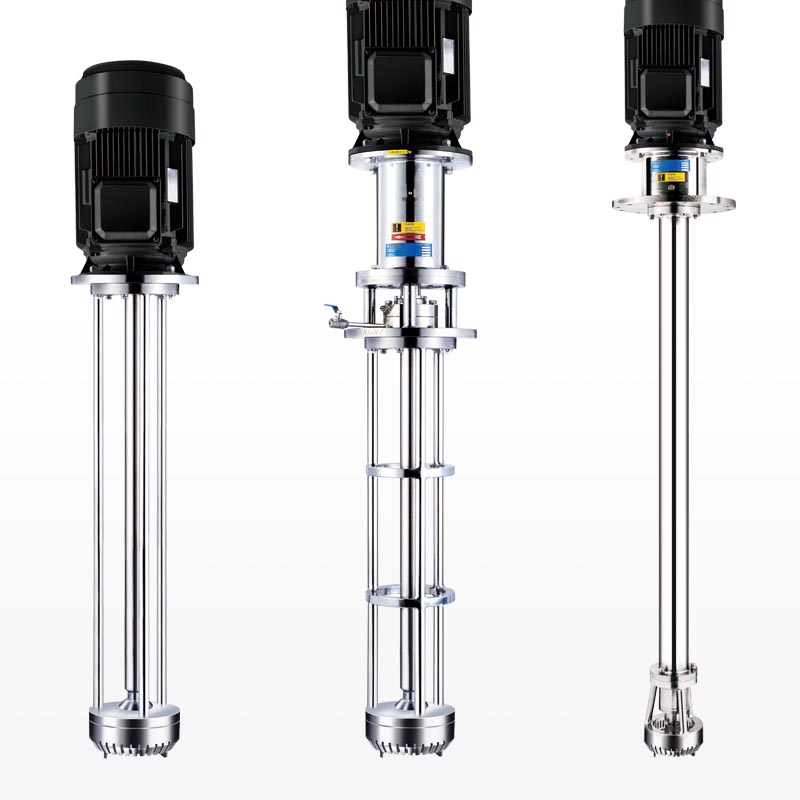
Rotor-stator high-shear mixers deliver steep shear and fast dispersion times; in lab trials they often produce sub-100 µm median sizes within minutes but consume higher power density and can generate heat. Planetary and planetary-centrifugal mixers yield lower shear with excellent wetting for hard-to-wet powders; expect slower dispersion and larger D50 (often 2–4× rotor-stator results) but gentler thermal profiles. Ultrasonic probes produce fine droplets/particles at low volume but scale poorly and require careful cavitation control. Ball or bead mills give narrow PSDs for abrasive or crystalline powders but introduce wear and potential contamination; monitor metal content post-run. Choose based on metric trade-offs: speed vs. heat vs. contamination risk.
Alternatives and comparative benchmarks
Compare three realistic options for a lab buyer: (1) small high-shear rotor-stator for rapid R&D iterations — benchmark: 0.5–5 L batches, D50 reduction to <100 µm in under 10 minutes for many formulations; (2) bench planetary mixers for tacky or high-viscosity slurries — their strength is homogeneity at low shear; (3) microfluidizers or ultrasonicators when droplet/particle uniformity below 10 µm is required. Use head-to-head runs with identical feedstock and standardized sampling to generate paired metrics (mean, SD, n≥4). Compare energy per unit mass (kJ/kg) and post-process temperature rise as decision criteria, not just time-to-target.
Common buyer mistakes and how data prevents them
Buyers often choose equipment on nameplate capacity or vendor claims without specifying acceptance criteria. Typical errors: underestimating cleaning downtime (CIP times can exceed processing times in lab setups), ignoring shear sensitivity of actives (leading to degraded potency), and failing to plan scale-up metrics (power per unit volume rarely scales linearly). Prevent these by requiring vendors to run a defined test protocol on your formulation: report PSD by laser diffraction, blend CV from at least five samples across the batch, and record energy input and temperature profiles. Ask for raw data files so you can compute effect sizes and confidence intervals rather than taking single-number claims at face value.
Design a test plan with statistical thresholds
Draft a test protocol that includes: (a) acceptance criteria — target D50 ±10% and blend CV ≤10%; (b) sample plan — n=5 spatial samples per batch, three replicate batches; (c) controlled inputs — powder moisture, feed rate, and solvent volume locked within ±5% for all runs. Use ANOVA to check batch-to-batch variation and set control limits at ±2σ. Record baseline power draw and temperature; if power or temperature deviates >15% from baseline, treat the run as an outlier and investigate shear or cavitation differences. These statistical controls convert anecdote into actionable procurement decisions.
Synthesis and practical outcome
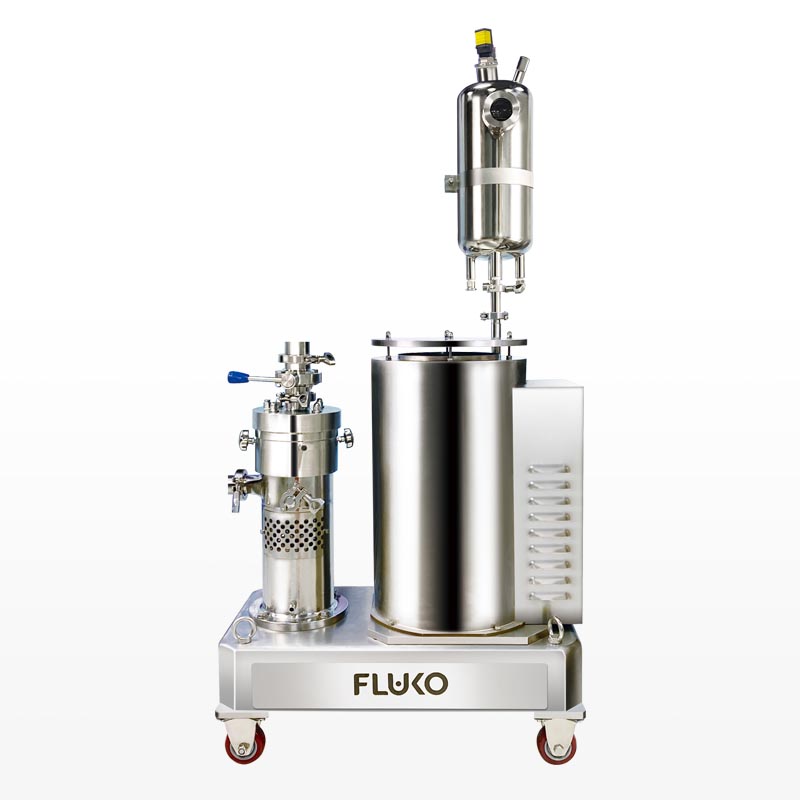
Metric-first evaluation steers buyers to predictable outcomes: define D50, CV, throughput and energy per mass; require replicated, vendor-run trials with raw data; and prioritize equipment whose measured trade-offs match your product constraints. When those measures align, procurement decisions reflect reproducible lab performance rather than sales narratives, and the value flows from comparative data to reliable, repeatable process behavior as demonstrated by specialists like FLUKO.
